
When the Pacific Ocean Changes the World’s Weather
Thousands of kilometers away from India’s coastline, the waters of the tropical Pacific Ocean quietly influence rainfall, droughts, heatwaves, storms, fisheries, and even food prices around the world. A slight rise in sea surface temperatures across this vast ocean can trigger weather changes that affect millions of people across continents.
Among the most closely watched climate events is El Niño, a naturally occurring phenomenon that has shaped global weather for centuries. Every few years, it alters rainfall patterns, weakens or strengthens monsoons, increases the likelihood of floods in some regions, and intensifies droughts in others.
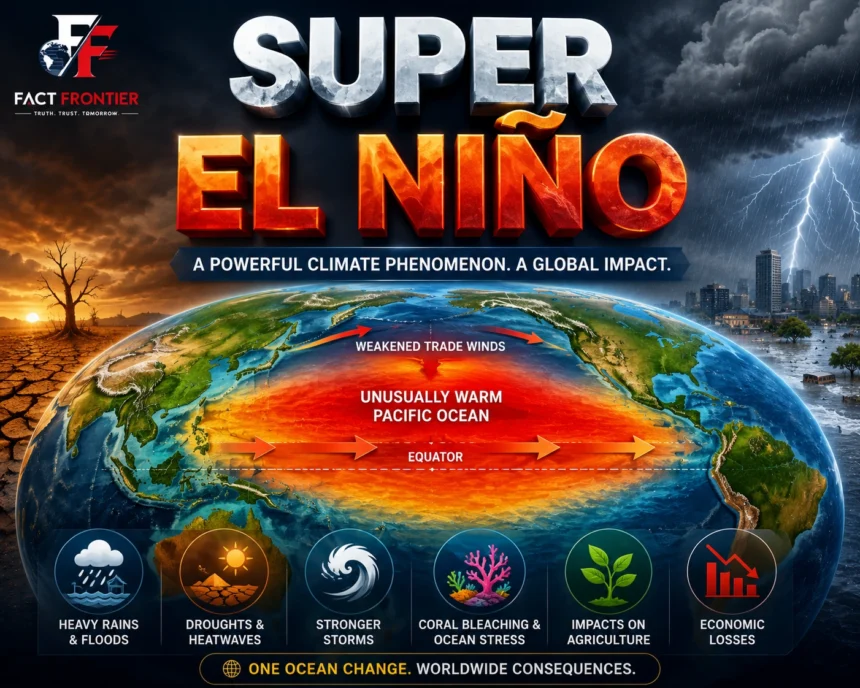
Occasionally, however, El Niño becomes exceptionally powerful. During these rare events, its influence extends across the globe with greater intensity. Although scientists do not officially classify it as a separate scientific category, these unusually strong episodes are widely referred to as “Super El Niño.”
Understanding how Super El Niño works has become increasingly important as climate extremes become more frequent and societies seek to prepare for changing weather patterns.
What Exactly Is El Niño?
El Niño is part of a larger natural climate system known as the El Niño–Southern Oscillation (ENSO).
ENSO describes recurring changes in ocean temperatures and atmospheric pressure across the equatorial Pacific Ocean.
Under normal conditions:
- Strong trade winds push warm surface water toward Indonesia and Australia.
- Cold, nutrient-rich water rises near the western coast of South America.
- Rainfall remains concentrated over the western Pacific.
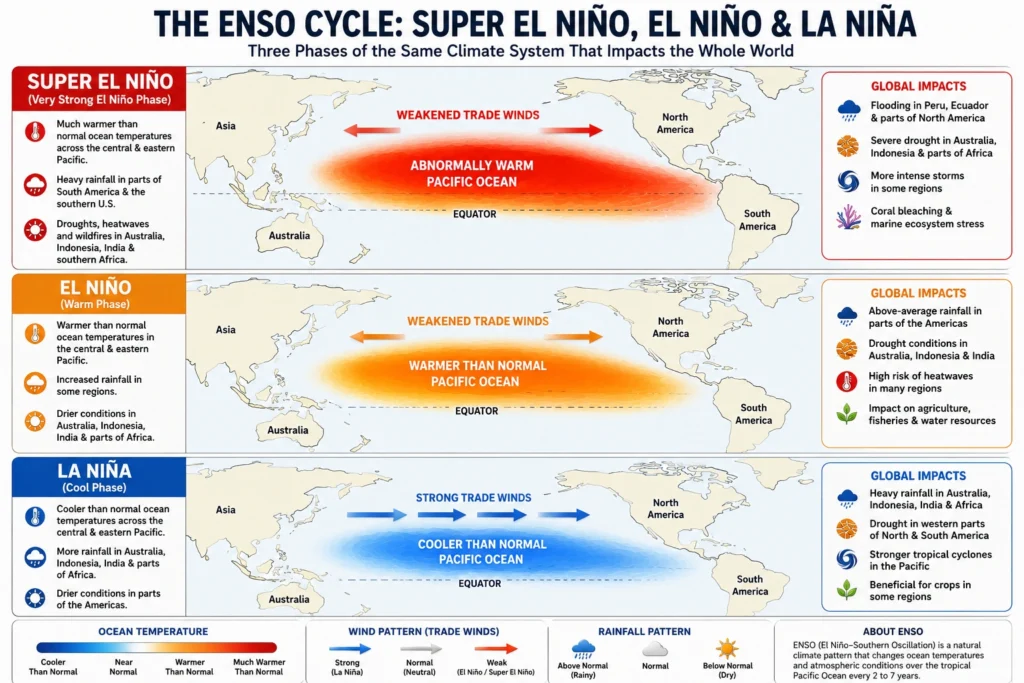
During an El Niño event, those trade winds weaken.
As a result:
- Warm ocean water spreads eastward.
- Sea surface temperatures rise in the central and eastern Pacific.
- Atmospheric circulation changes.
- Rainfall shifts across different parts of the world.
Although these temperature changes occur in one ocean basin, they influence weather patterns across nearly every continent through atmospheric “teleconnections.”
Why Is It Called “Super El Niño”?
The term Super El Niño is widely used by meteorologists and the media to describe exceptionally strong El Niño events.
It is important to understand that “Super El Niño” is not an official scientific classification used by organizations such as the World Meteorological Organization (WMO) or NOAA.
Instead, the expression generally refers to El Niño episodes in which sea surface temperature anomalies in the central-eastern Pacific become unusually large and remain elevated for an extended period.
Historically, only a handful of El Niño events have reached this level of intensity.
Among the strongest were:
- 1982–1983
- 1997–1998
- 2015–2016
These events produced widespread droughts, floods, coral bleaching, agricultural losses, and record-breaking global temperatures.
Because of their extraordinary impacts, they became known informally as “Super El Niño” events.
The Science Behind the Phenomenon
The Pacific Ocean behaves like a giant heat reservoir.
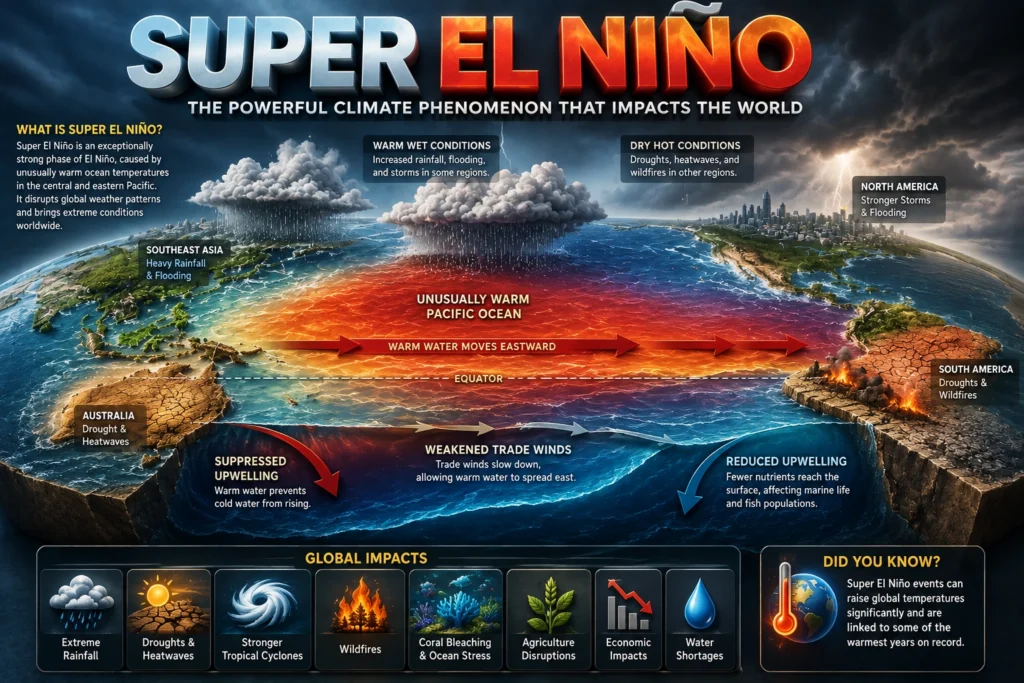
Normally, easterly trade winds continually push warm water toward Southeast Asia and northern Australia. This movement allows colder water from deeper layers of the ocean to rise along the South American coast, a process known as upwelling.
Upwelling supports one of the world’s richest marine ecosystems by bringing nutrients to the surface.
During El Niño:
- Trade winds weaken.
- Upwelling becomes less effective.
- Warm water spreads eastward.
- The eastern Pacific becomes unusually warm.
- Air pressure patterns shift across the Pacific.
- Thunderstorm activity moves eastward.
These changes disrupt global atmospheric circulation.
As the atmosphere adjusts, regions thousands of kilometers away experience changes in rainfall, temperature, and storm activity.
This explains why an event that begins in the Pacific Ocean can influence weather in India, Africa, North America, South America, and Australia.
Source: – The World Meteorological Organization (WMO) regularly publishes global climate outlooks and ENSO forecasts used by meteorological agencies worldwide.
How Was El Niño Discovered?
Long before satellites monitored ocean temperatures, fishermen along the coasts of Peru and Ecuador noticed a curious pattern.
Every few years, around Christmas, unusually warm water appeared offshore.
Fish became scarce because nutrient-rich cold water stopped rising from the deep ocean.
Since the warming often appeared near Christmas, local fishermen named it “El Niño,” meaning “The Little Boy” or a reference to the Christ Child in Spanish.
During the twentieth century, scientists realized that this warming was linked to large-scale changes in atmospheric pressure across the Pacific.
British climatologist Sir Gilbert Walker identified these atmospheric fluctuations, later called the Southern Oscillation.
By combining ocean observations with atmospheric science, researchers eventually recognized ENSO as one of Earth’s most influential climate systems.
Super El Niño vs. El Niño vs. La Niña
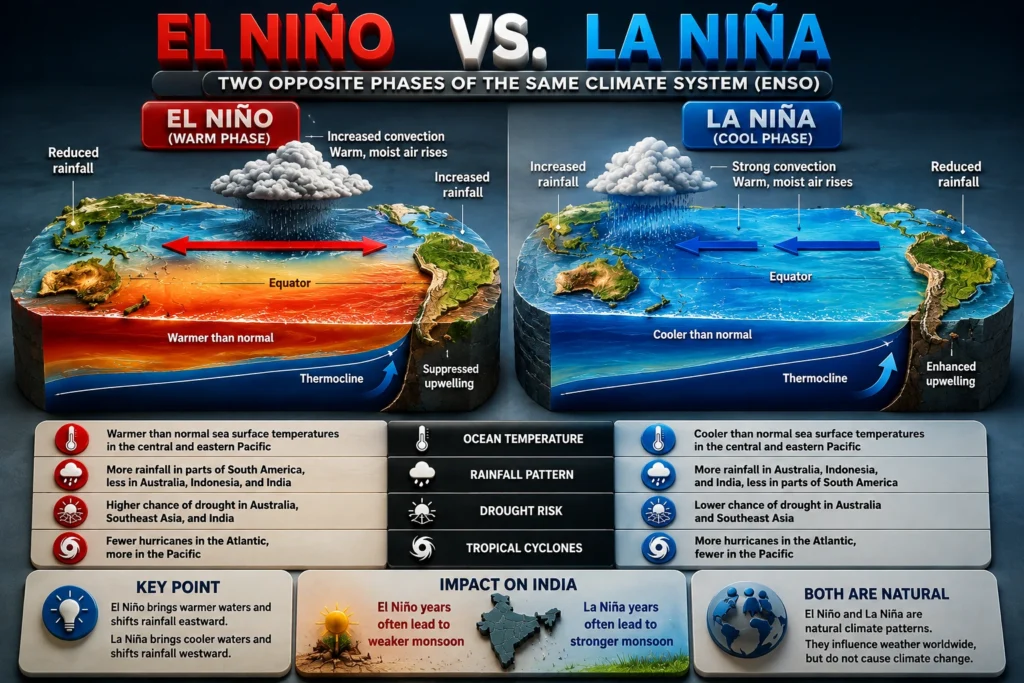
Although all three belong to the ENSO cycle, they produce very different weather patterns.
| Pacific Ocean Temperature | Cooler than average | Near average | Warmer than average | Exceptionally warm |
| Trade Winds | Strong | Normal | Weak | Much weaker |
| Global Weather Impact | Moderate | Stable | Significant | Severe |
| Extreme Weather Risk | Moderate | Lower | Higher | Highest |
Super El Niño is essentially an unusually intense El Niño event, not a separate climate phenomenon.
The Strongest Super El Niño Events in History
1982–1983
One of the first modern Super El Niño events caught scientists by surprise.
It caused severe flooding in parts of South America while contributing to droughts in Australia and Indonesia. Economic losses reached billions of dollars.
1997–1998
Often regarded as one of the strongest El Niño events ever recorded, this episode affected weather across nearly every continent.
Major floods occurred in Peru and Ecuador, while Indonesia experienced devastating droughts and widespread forest fires. Coral reefs suffered extensive bleaching, and global temperatures rose significantly.
2015–2016
This event coincided with record-breaking global temperatures.
Many countries experienced extreme heat, water shortages, crop losses, and unusual weather patterns.
Scientists also documented one of the largest global coral bleaching events on record, particularly affecting Australia’s Great Barrier Reef.
Why Scientists Closely Monitor Every El Niño
Today, scientists monitor the Pacific Ocean continuously using satellites, drifting buoys, research vessels, and climate models.
Organizations such as the World Meteorological Organization (WMO), the U.S. National Oceanic and Atmospheric Administration (NOAA), and other national meteorological agencies regularly analyze sea surface temperatures, atmospheric pressure, and trade wind strength.
Their forecasts help governments prepare for:
- Droughts
- Floods
- Heatwaves
- Agricultural planning
- Water resource management
- Disaster preparedness
Because Super El Niño events can influence multiple sectors simultaneously, early forecasting has become one of the most valuable tools in modern climate science.
When One Ocean Influences the Entire Planet
The Pacific Ocean covers nearly one-third of Earth’s surface, so even small changes in its temperature can ripple through the global climate system. During a strong El Niño, these changes don’t remain confined to the Pacific—they alter atmospheric circulation, jet streams, and rainfall patterns across continents.
When an unusually intense event occurs, its effects become more widespread. Some regions receive excessive rainfall and flooding, while others face prolonged droughts, heatwaves, crop losses, and water shortages.
This is why governments, farmers, disaster management agencies, and scientists closely monitor every sign of a strengthening El Niño.
How Super El Niño Affects Different Parts of the World
Although every El Niño behaves differently, past strong events have shown several recurring patterns.
South America
Countries such as Peru and Ecuador often experience unusually heavy rainfall, flash floods, landslides, and damage to roads, homes, and agriculture.
Australia and Indonesia
These regions frequently become hotter and drier during strong El Niño years.
Reduced rainfall increases the risk of:
- Drought
- Water shortages
- Crop failures
- Large-scale bushfires and forest fires
North America
El Niño can shift winter storm tracks across the United States.
Some southern states may experience wetter-than-average winters, while northern regions can become comparatively milder. However, the exact impacts vary from one event to another.
Africa
Eastern and southern Africa often experience contrasting impacts.
Some countries receive above-average rainfall, while others struggle with prolonged dry conditions that affect agriculture and food security.
Source: – Seasonal forecasts and ENSO monitoring are provided by the NOAA Climate Prediction Center, one of the leading authorities on climate prediction.
Why India Watches Every El Niño Forecast
For India, El Niño is more than a climate event—it has significant economic importance.
The southwest monsoon supplies nearly three-quarters of the country’s annual rainfall. Agriculture, reservoirs, hydroelectric power generation, and drinking water all depend heavily on its performance.
Historically, many—but not all—strong El Niño years have been associated with weaker-than-normal monsoon rainfall.
A weaker monsoon can lead to:
- Reduced crop yields
- Lower reservoir levels
- Increased irrigation demand
- Pressure on food prices
- Heatwave conditions across several states
At the same time, it is important to remember that El Niño is only one factor influencing the Indian monsoon. Conditions in the Indian Ocean, the Madden–Julian Oscillation (MJO), Eurasian snow cover, and regional weather systems also play important roles.
Impact on Agriculture and Food Security
Agriculture is often one of the first sectors affected by a strong El Niño.
Lower rainfall or delayed monsoon onset can reduce production of crops such as:
- Rice
- Maize
- Soybean
- Sugarcane
- Pulses
Livestock may also face water shortages and reduced pasture availability.
On the other hand, excessive rainfall in some regions can damage crops through flooding and waterlogging.
Because agriculture influences food prices, employment, and rural incomes, governments closely monitor seasonal climate forecasts before each planting season.
Oceans Feel the Impact Too
Super El Niño affects not only weather but also marine ecosystems.
Warmer ocean temperatures reduce the supply of nutrient-rich water rising from deeper layers. This decline in upwelling affects plankton, fish populations, and larger marine animals that depend on them.
One of the most visible consequences is coral bleaching.
When ocean temperatures remain unusually warm for long periods, corals expel the microscopic algae that provide them with food and color.
Repeated bleaching events weaken coral reefs, making them more vulnerable to disease and mortality.
Latest Climate Outlook (2026)
Climate agencies around the world are closely monitoring the Pacific Ocean.
According to the World Meteorological Organization (WMO), El Niño conditions developed during 2026 and are expected to strengthen through the second half of the year. WMO forecasts indicate about an 80% probability of El Niño during June–August 2026, with a high likelihood of persisting into late 2026. The organization has warned that many regions could experience above-average temperatures and a higher risk of extreme weather, urging governments to prepare in advance.
Similarly, forecasting centers associated with NOAA indicate that ocean warming in the equatorial Pacific is increasing and that there is potential for a strong El Niño later in the year, although the exact peak intensity remains uncertain.
Some media reports have described the developing event as a possible “Super El Niño.” However, scientists emphasize that this is an informal term rather than an official scientific category, and the eventual strength of the event will depend on how ocean and atmospheric conditions evolve over the coming months.
Is Climate Change Making El Niño Stronger?
This remains one of the most active areas of climate research.
Scientists generally agree on two important points:
- El Niño itself is a natural climate cycle.
- Human-caused climate change is warming the planet.
What researchers are still studying is how global warming influences the frequency, intensity, and impacts of future El Niño events.
Several studies suggest that a warmer atmosphere can amplify the effects of strong El Niño episodes, leading to more intense heatwaves, heavier rainfall in some regions, and more severe droughts in others. However, there is no scientific consensus that climate change is directly causing every strong El Niño event. Ongoing research continues to refine this understanding.
Source: – Satellite observations from NASA Earth Observatory help scientists monitor changes in Pacific Ocean temperatures during El Niño events.
Looking Ahead
As forecasting technology improves, governments receive earlier warnings than ever before.
Satellites, ocean-monitoring buoys, underwater sensors, and advanced climate models now allow scientists to detect warming trends months in advance.
These forecasts help countries prepare for:
- Water management
- Agriculture planning
- Disaster response
- Public health
- Energy demand
- Food security
The challenge is no longer simply predicting El Niño, but turning climate information into practical action.
A Natural Cycle in a Warming World
Super El Niño reminds us that Earth’s climate is deeply interconnected. A shift in ocean temperatures thousands of kilometers away can influence rainfall over India, reshape fisheries off South America, increase wildfire risks in Australia, and alter winter weather in North America.
While El Niño is a natural part of the Earth’s climate system, its effects unfold in a world that is already warmer than it was decades ago. That combination makes accurate forecasting, climate resilience, and informed planning more important than ever.
Understanding Super El Niño is not just about studying the Pacific Ocean—it is about recognizing how closely connected the planet’s oceans, atmosphere, ecosystems, and societies truly are.
Fact Box 1: Super El Niño at a Glance
| Scientific System | El Niño–Southern Oscillation (ENSO) |
| Ocean Involved | Equatorial Pacific Ocean |
| First Recognized | By Peruvian fishermen (centuries ago); scientifically studied in the 20th century |
| Official Scientific Term? | No (“Super El Niño” is an informal term for exceptionally strong El Niño events.) |
| Main Driver | Unusually warm sea surface temperatures in the central and eastern Pacific |
| Frequency | Irregular, typically every 2–7 years for El Niño events |
| Major Impacts | Droughts, floods, heatwaves, coral bleaching, agricultural disruption |
Fact Box 2: 7 Powerful Facts About Super El Niño
- It begins in the tropical Pacific Ocean but influences weather worldwide.
- It is not a separate climate phenomenon; it refers to an exceptionally strong El Niño.
- It can weaken the Indian summer monsoon, though other climate factors also influence rainfall.
- Strong El Niño events have contributed to some of the warmest years on record.
- Marine ecosystems often suffer because warmer waters reduce nutrient-rich upwelling.
- Early forecasts help governments prepare for droughts, floods, and food security challenges.
- Scientists continue studying how climate change may affect future strong El Niño events.
Fact Box 3: Myth vs. Fact
Myth
Super El Niño happens every year.
Fact: El Niño events occur irregularly, generally every 2–7 years, and only a few become exceptionally strong.
Myth
Every El Niño causes drought everywhere.
Fact: El Niño shifts rainfall patterns. Some regions become drier, while others experience unusually heavy rainfall.
Myth
Climate change created El Niño.
Fact: El Niño is a natural ocean–atmosphere cycle. Scientists are studying how global warming may influence its intensity and impacts.
Myth
Scientists can stop El Niño.
Fact: No. Scientists can forecast El Niño and help societies prepare, but they cannot prevent it.
Source: – Copernicus Climate Change Service (C3S) provides global climate datasets and temperature analyses used by researchers worldwide.
Timeline of Major El Niño Events
| 1891 | Sir Gilbert Walker began studying atmospheric pressure patterns linked to ENSO. |
| 1982–1983 | One of the first globally recognized Super El Niño events caused widespread economic losses. |
| 1997–1998 | One of the strongest El Niño events on record, bringing floods, droughts, and coral bleaching worldwide. |
| 2015–2016 | Another exceptionally strong event associated with record global temperatures and severe coral bleaching. |
| 2023–2024 | Strong El Niño influenced global temperatures and weather extremes. |
| 2026 | Climate agencies are closely monitoring strengthening El Niño conditions and assessing the possibility of a very strong event. |
Frequently Asked Questions (FAQs)
1. What is Super El Niño?
Super El Niño is an informal term used to describe an exceptionally strong El Niño event with unusually high sea surface temperature anomalies in the tropical Pacific Ocean.
2. Is Super El Niño an official scientific category?
No. Organizations such as the World Meteorological Organization (WMO) and NOAA do not officially classify “Super El Niño” as a separate climate category.
3. How does El Niño affect India?
It can influence the Indian summer monsoon, increasing the risk of below-average rainfall in some years. However, the monsoon is also affected by several other climate systems.
4. Does El Niño cause global warming?
No. El Niño is a natural climate cycle, while global warming is driven primarily by increased greenhouse gas concentrations. El Niño can temporarily add to global temperatures.
5. Which countries are most affected?
Countries across South America, Australia, Indonesia, India, parts of Africa, and North America often experience significant weather changes during strong El Niño events.
6. How often does El Niño occur?
El Niño events generally develop every 2–7 years, although their strength and duration vary.
7. Can scientists predict El Niño?
Yes. Modern satellites, ocean-monitoring buoys, and climate models allow scientists to forecast El Niño several months in advance.
8. What is the difference between El Niño and La Niña?
El Niño is associated with warmer-than-average Pacific Ocean temperatures, while La Niña is linked to cooler-than-average conditions.
Also Read: – Ghost Particles (Neutrinos): The Invisible Messengers of the Universe
📚 Verified Research Sources & Fact-Checking Citations
At FactFrontier, every claim is cross-referenced with primary scientific databases, institutional research archives, and verified historical records:
- IUCN Red List of Threatened Species: Global species conservation assessments and population surveys.
- Wildlife Institute of India (WII) & Project Tiger: Field census data and ecological habitat monitoring.
- National Geographic & Zoological Society Research: Ethological observations and biodiversity metrics.